What Color is Your Coffee? | 25, Issue 21

University of California Davis Coffee Center scientists LAUDIA ANOKYE-BEMPAH, IRWIN R. DONIS-GONZÁLEZ, and WILLIAM D. RISTENPART describe research undertaken in 2023 with a goal of developing new roast color standards for the coffee industry..

The goal of any researcher is to investigate a topic that has maximum relevance to the real world, standing to benefit people in their daily lives. Over the years, when researching the preferences of specialty coffee consumers, one thing stood out: “roast level” is a key piece of information that coffee lovers use to make choices about which coffee they buy. In the 2023 National Coffee Data Trends study, a whopping 70% of coffee consumers said that they were “much” or “somewhat” more likely to buy a coffee when “the roast level was specified.”[1] This makes sense: recent research at UC Davis, supported by the Coffee Science Foundation, showed that roast level drove the greatest flavor differences in the perception of filter coffee.[2]
So, we know that understanding roast color is absolutely critical to the coffee trade. The trouble is, as most coffee professionals quickly learn, there are few widely adopted standards to describe and communicate roast level. This presents a significant problem as new technologies emerge to help roasters measure roasted coffee—how can we create a useful system to understand roast levels without a coherent system to measure them? For this reason, in 2020, the Coffee Science Foundation adopted a strategy to pursue research on roast color, with the aim of providing scientifically valid information to the SCA. This information could be used by the SCA’s standards to develop a standardized terminology for roast color and level that could serve the entire industry.
Fortunately, in 2022, we learned that the UC Davis Coffee Center was pursuing a comprehensive research project to understand the physical and chemical changes that coffee undergoes in the roaster. Focused on “roast profiles,” the researchers were collecting thousands of measurements from roasting coffee: temperature, time, weight, chemistry and … color. The CSF approached the researchers with a question: could we take the next step, analyzing and organizing the collected color information with the aim of developing a universal system to describe roast color? The researchers were enthusiastic, and dug into the task, using the CIELAB color analysis system to understand the color spectrum of roasted coffee. From there, this spectrum of coffee color could be shown to coffee professionals, who helped to categorize and name the colors according to experience and industry norms.
Here, you’ll see an early report from this ongoing research, describing the techniques, tools, and procedures that are helping us understand the colors of roasted coffee. I’m thrilled with this project, and eager to learn more as the research proceeds in understanding the dynamics, tools, and importance of roast color.
PETER GIULIANO
Chief Research Officer, SCA
Chief Executive Officer, Coffee Science Foundation
Imagine a simple thought experiment: you walk into a room full of coffee lovers, show them some coffee beans, and ask them, “What color are these beans?” Provided that the beans have been roasted, you likely will get responses mainly featuring the word “brown.”
But now imagine that you ask them, “Are these beans light, medium, or dark roasted?” Most likely, pandemonium will reign! Even a room of coffee experts with years of experience can look at the same beans and describe their roast levels very differently. Some roasters famously sell “light roasts” darker than the “dark roasts” produced by other roasters. Despite how vital roast level is for coffee, there are no agreed-upon standards.
It is important to establish clear standards for the coffee industry. When purchasing coffee, consumers often consider the roast level as a primary factor. If roasters mislabel their coffee or if consumers are unsure about their preferences, it can result in lost sales for the roasters. Some consumers might be convinced, for example, that they don’t like “light roasts” because they tasted something once that was so labeled but was much darker than the average light roast (or vice versa!). Within the coffee industry, a lack of clear standards also complicates quality control, hindering communication between vendors and partners.
This raises the question of how the industry currently assesses the color and corresponding roast level of their coffee. For years, the de facto standard for the Specialty Coffee Association (SCA) has involved equipment like Agtron™ analyzers, which use proprietary technology to yield a number ranging from 100 for very lightly roasted coffee to 20 for very darkly roasted coffee. Consumers have no idea what these numbers mean, however, and more importantly, not everyone in the coffee industry can afford this equipment. According to a survey we conducted at the Roasters Guild Retreat in 2023, half of the specialty coffee roasters in attendance described the roast level of their beans “simply by looking at them.”
In general, using your eyeballs is a terrible way to determine something as crucial as roast level. “Color” is defined by personal perception and subjective interpretation, and many factors affect how we perceive it: the same beans will look different depending on the intensity and type of illumination (e.g., natural versus fluorescent light). Likewise, the angle of the available light and the color of objects in the background both affect the perceived color of the beans. Even if these details were nailed down, in the end, a human looking at the beans would have to decide on the appropriate color name—and at present, there isn’t much of a plain language vocabulary to describe different shades of brown related to roasted coffee.
This all means that the coffee industry would benefit greatly from improved methods of measuring coffee color and forming standards to characterize those colors as indicating specific roast levels.
We are happy to report that the University of California Davis (UC Davis) Coffee Center has been performing a large-scale research project with precisely those goals in mind. With philanthropic support from Probat and the Coffee Science Foundation, we have been systematically investigating how different roast profiles affect the physical, chemical, and sensorial aspects of coffee, including the color of these profiles as well as the words used to describe them. The roast profiles were purposely chosen to be wildly different,[3] using several dramatically different types of green coffee. For each experiment, precise colorimetric measurements of the coffee color versus roasting time were critical, yielding thousands of color measurements.
Meet the “Universal Coffee Color Curve”
The details are currently under review in scientific journals. Here we want to share the most exciting result: regardless of the wildly different roast profiles and wildly different green beans, all the measured colors, to a good approximation, obeyed what we are calling “the universal coffee color curve.”
To explain this color curve, we first must explain a bit about quantitative color measurements. Human vision is based on three types of “cone” cells within the eye that respond primarily to red, green, or blue light, respectively. This means that any human-perceptible color must be characterized by at least three different numbers, which can be represented in a three-dimensional plot or “color space.”
Within the scientific community, arguably the most widely used three-number color space is the CIELAB color space, also known as L*a*b* (Figure 1).[4] This color space was initially designed in the 1970s by the International Commission on Illumination (CIE) to serve as a “perceptually uniform space,” where a specific difference in number always corresponds to a similar change in color as perceived by humans. The first number is L* (pronounced “L star”), which indicates “lightness,” with 0 as pure black and 100 as pure white. The second number, a*, denotes red versus green, with –100 representing green and +100 representing red. Finally, the third number, b*, denotes blue versus yellow, with –100 representing blue and +100 representing yellow. So, for example, a particular shade of purple has (L* a* b*) = (50, 30, –30), which is a way of quantifying a specific mixture of red and blue.

Figure 1. The CIELAB color space.

Figure 2. The Universal Coffee Color Curve.
This L*a*b* color space allows us to unambiguously define the universal coffee color curve (Figure 2). What we show here is the summary (or “best fit”) of thousands of measurements of L*a*b* for all the different roast profiles and green coffee types, plotted in three dimensions with L* as the vertical axis and a* and b* as the horizontal axes. All our experimental measurements followed this curve, starting near L* = 60 for green coffee and reaching about L* = 20 for very dark coffee.
Interestingly, as roasting progresses, L* first increases slightly—it becomes lighter—before decreasing. Likewise, a* and b* increase near the beginning of a roast (i.e., the coffee becomes more red and more yellow, which we perceive as a dark orangish-yellow) before both color values turn around and head toward zero as the roast continues.
An essential aspect of this universal coffee color curve is that critical points in the roast happen at specific colors. The green coffees we measured had many variations (or “scatter”) in their colors. Still, when they reached “color change” (as indicated qualitatively by Tim Styczysnki, our expert head roaster at the UC Davis Coffee Center), the coffee always had L*a*b* values extremely close to the point denoted on the universal curve. Likewise, regardless of roast profile or coffee origin, the coffees always had nearly the same L*a*b* values when reaching the first and second crack. So, whether you roast very fast or slow, or even have a negative rate of rise in the middle of the roast, it doesn’t significantly affect the color of the beans when they hit the first or second crack.
This color universality has an important implication for the coffee industry: it means that we can use a scientifically rigorous color space to define a quantitative standard for “roast level” precisely. Importantly, because all the observed roast colors (to a good approximation) follow the single universal curve, we don’t even have to use three numbers to define the roast level—any set of L*a*b* coordinates can be converted to a single “distance along the curve” using whatever scale we like (e.g., 100 for green, 0 for pure black charcoal). Furthermore, the universal coffee color curve can help with the issue of consumer confusion, by helping guide the selection of plain language names for the different colors observed along the curve. Consumers don’t know what a “75 roast level” is, but they’ll better understand what “reddish brown” means. The universal color curve tremendously decreases the number of colors that need to be considered for meaningful names.
Developing a Color Name Dictionary
The UC Davis Coffee Center was very excited to partner with the SCA to work on developing a color name dictionary, using the universal coffee color curve as a guide. Specifically, in 2023, the Coffee Science Foundation (the research arm of the SCA) provided funding for us to conduct surveys of coffee industry experts about their preferred names for specific coffee colors. We conducted our first survey at the SCA Roasters Guild Retreat in the fall of 2023; 125 participants looked at samples of ground coffee under controlled illumination conditions and chose what they thought the “best” color name was for each sample (Figure 3). They also chose which coffee samples best represented light, medium, or dark roast.

Figure 3A. Members of the SCA Coffee Roasters Guild participating in a color-naming survey on September 29, 2023. The participants looked at samples of ground coffee in controlled illumination boxes.
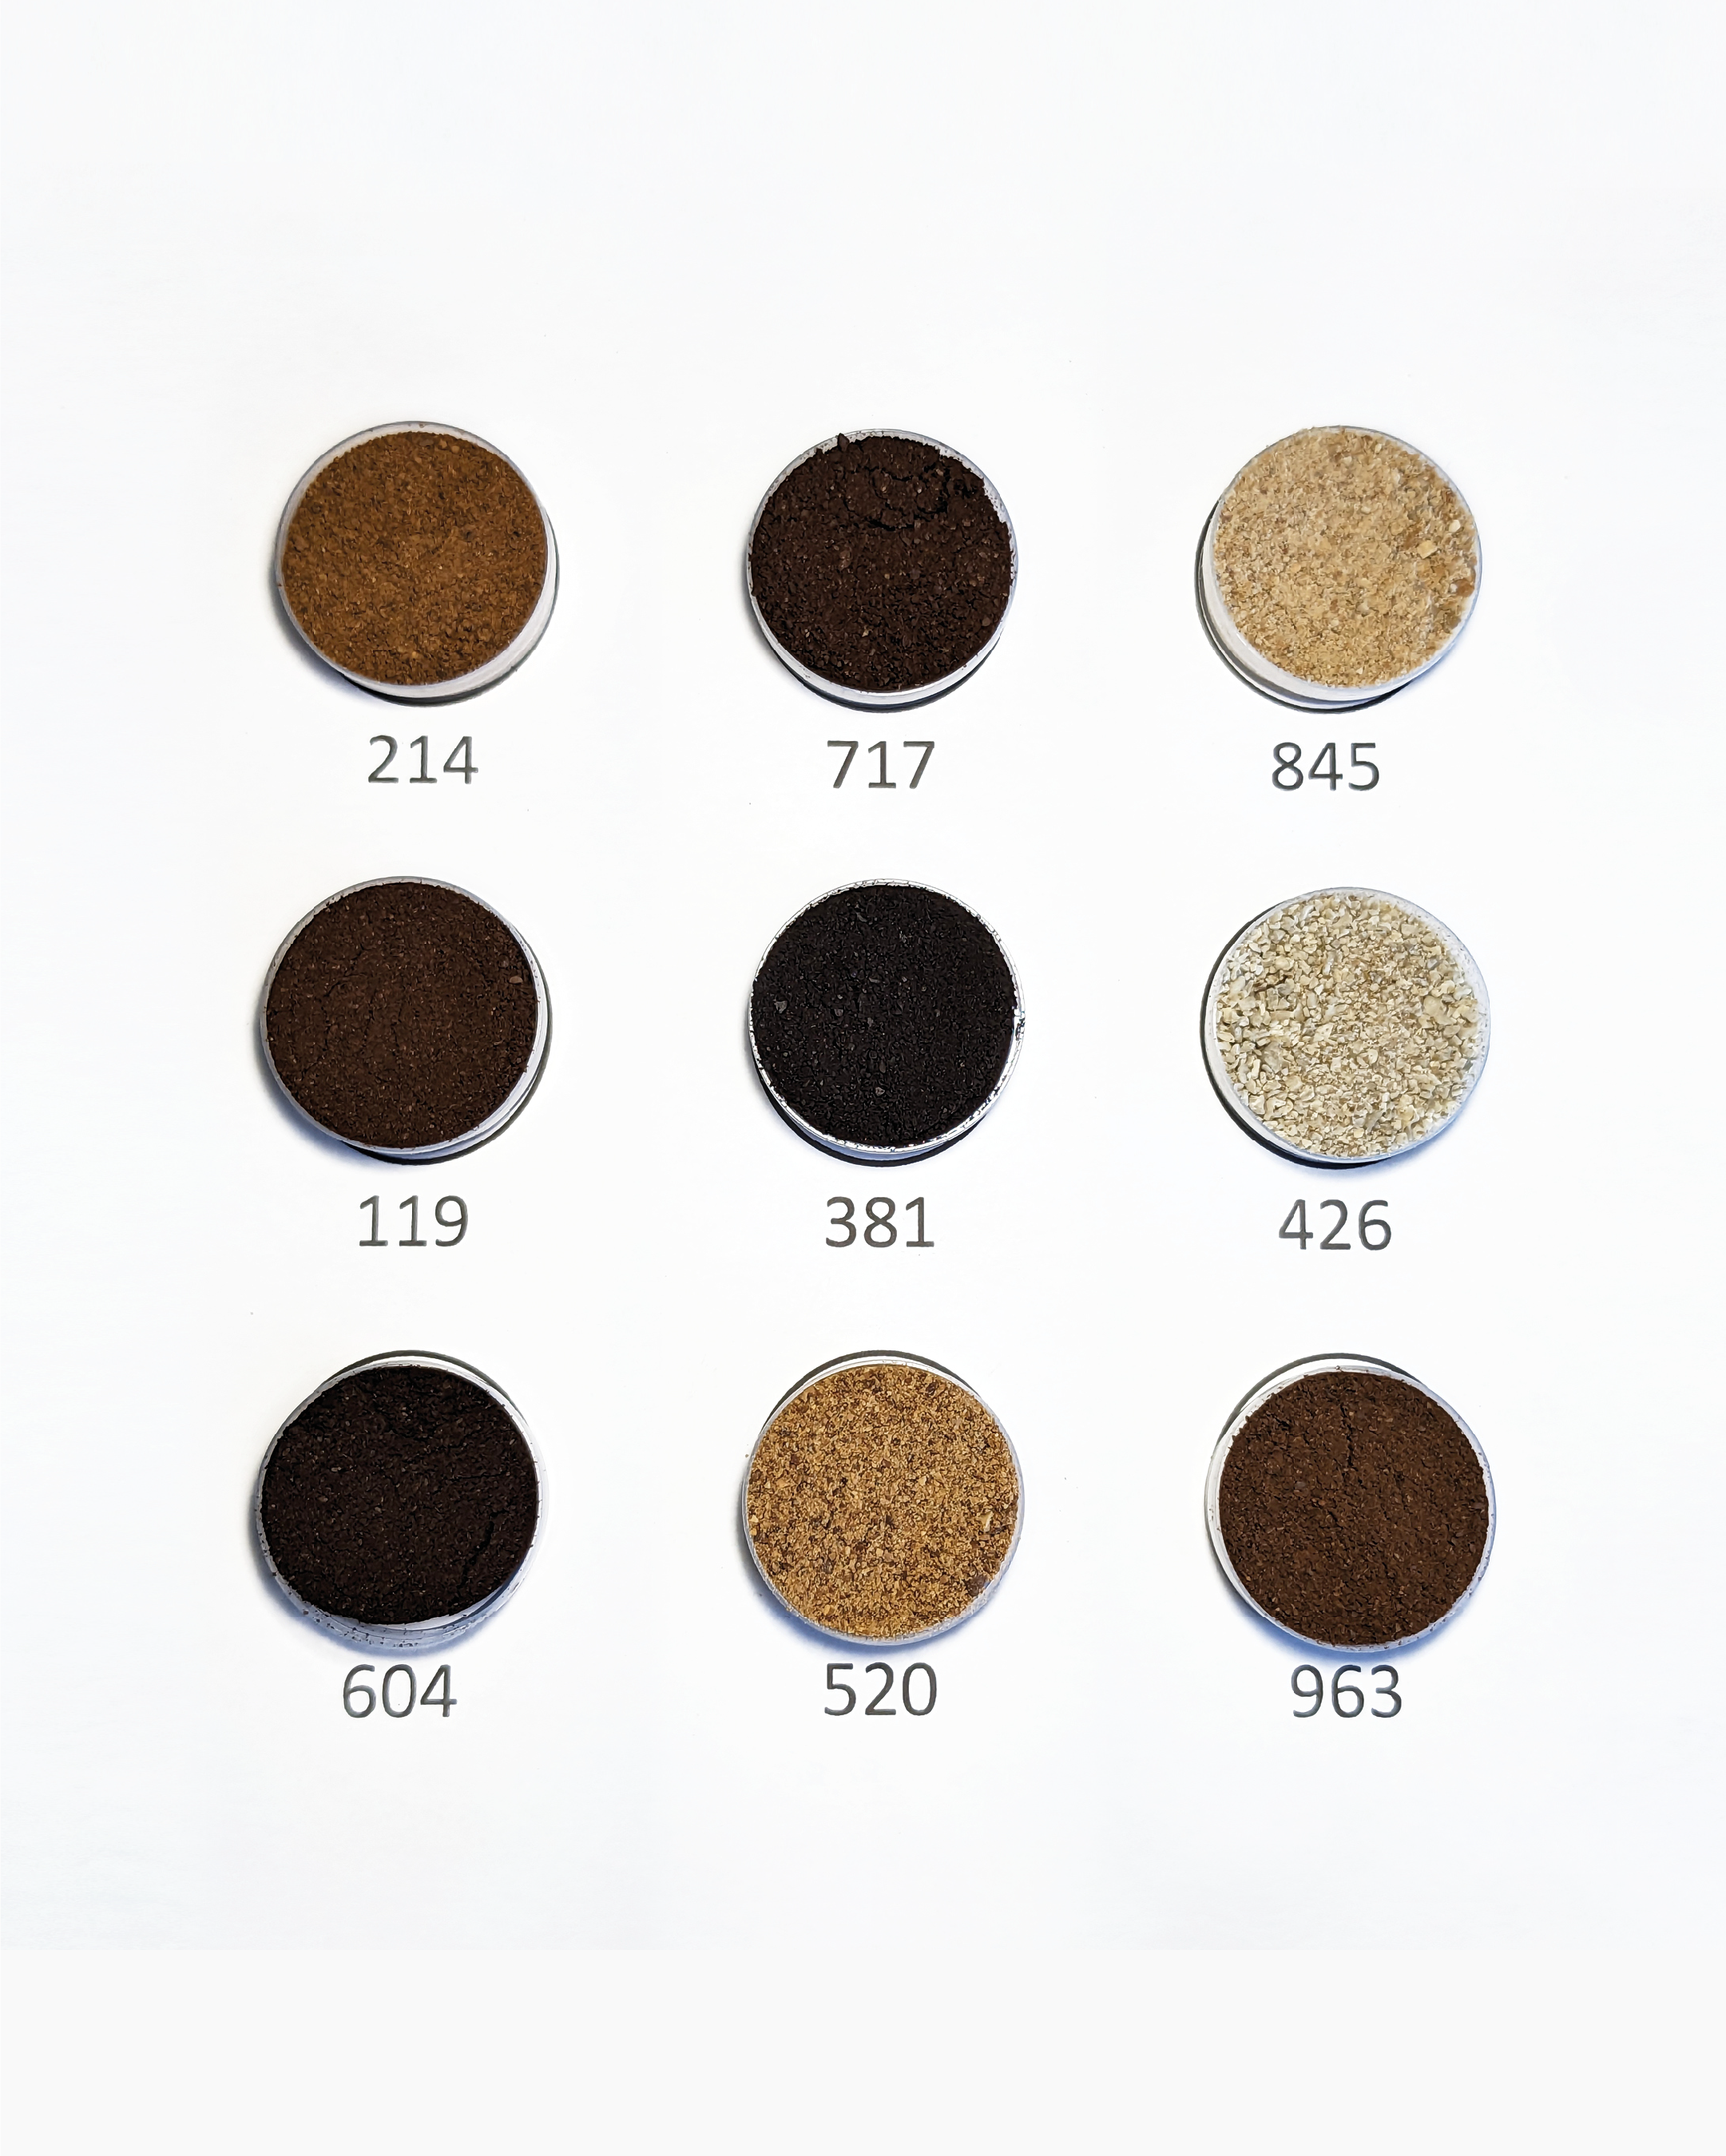
Figure 3B. The participants looked at samples of ground coffee in controlled illumination boxes.
The details of this survey are in preparation for peer review in a scientific journal, so here we will again zoom in on the most critical result: Table 1 shows a draft version of a “color dictionary” based on our initial survey results. At the far right are the L*a*b* color coordinates corresponding to the universal coffee color curve, with all 22 rows evenly spaced apart in perceptual color space. On the far left, we have the roast milestones of “color change,” first crack, and second crack. In the middle, we denote various levels of named colors. At the simplest (Level 1), coffee is simply yellow, brown, or black. At Level 2, we use adjective modifiers (e.g., “reddish” brown or “deep” brown) to provide differentiation, and at Level 3, we further differentiate using “lighter,” “moderate,” or “darker.” The proposed color names, combined with quantitatively defined color coordinates, provide a rigorous framework for communicating with consumers and coffee industry professionals about the color of a specific coffee. Most importantly, the table provides a framework to denote coffees of specific colors belonging to a particular roast level. Commercially available coffees typically will fall into the light, medium, and dark roast categories. Still, for completeness, the color dictionary includes white roast coffee and ultradark coffee (which is extremely black).

Table 1. Draft version of a “color dictionary” based on initial survey results.
We emphasize that Table 1 is a rough draft, and we are sure many coffee industry veterans will have strong opinions about where the dividing lines should be. That’s OK—we will continue to gather survey data from as many coffee industry members as possible to ensure that the final version of the color dictionary is based on statistically significant data. Ultimately, however, our job at the UC Davis Coffee Center is to generate hard data—it is up to the SCA and the entire coffee community to agree upon official standards. No matter how that process turns out, however, we are excited that soon there will be more precise ways for both consumers and coffee industry experts to answer the question: “What color is my coffee?” ◇
PhD student LAUDIA ANOKYE-BEMPAH, Associate Professor IRWIN R. DONIS-GONZÁLEZ, and Professor WILLIAM D. RISTENPART are scientists at the University of California Davis Coffee Center.
The authors would like to thank Probat for supporting the roast profile research; the Coffee Science Foundation for supporting the color dictionary research; ALICE DIEN and SHRISHTI CHEZHIAN for their work on color measurements that helped inform the color curve; and TIM STYCZYNSKI for guiding our selection of roast profiles and performing the roasts.
The Coffee Science Foundation will amplify the academic research papers referenced by the authors once published on its project index at coffeescience.foundation. To learn more about the SCA’s development process for its standards, please visit sca.coffee/standards.
References
[1] National Coffee Association, 2023 National Coffee Data Trends Study.
[2] Scott C. Frost, William D. Ristenpart, Jean-Xavier Guinard, "Effects of Brew Strength, Brew Yield, and Roast on the Sensory Quality of Drip Brewed Coffee," Journal of Food Science (July 2020): https://doi.org/10.1111/17503841.15326.
[3] Common terms for some of these different roast profiles include “fast start,” “slow start,” “negative rate-of-rise,” “exaggerated flick,” and several others.
[4] In 2022, Issue 17 of 25 covered a research paper on the use of the CIELAB space to better understand how roast level and brew temperature impacted the color of brewed coffee. Read it here: https://sca.coffee/sca-news/25/issue-17/the-color-in-your-cup-roast-level-and-brew-temperature-significantly-affect-the-color-of-brewed-coffee.

We hope you are as excited as we are about the release of 25, Issue 21. This issue of 25 is made possible with the contributions of specialty coffee businesses who support the activities of the Specialty Coffee Association through its underwriting and sponsorship programs. Learn more about our underwriters here.