Community Impact of COVID-19: Results from the Korean- and Chinese-language Surveys

Over the past year and a half, the Specialty Coffee Association (SCA) launched a series of surveys to better understand how the COVID-19 pandemic was affecting the specialty coffee community.
KATIE VON DER LIETH and KYONGHEE SHIN share the results of the Korean and Chinese language editions of the survey, highlighting interesting findings and making comparisons between language groups and geographies. 한국어 기사는 이 곳을 클릭해서 확인하세요.
We launched the first survey in March 2020 shortly after shutdowns began in the United States and Europe. Unsure about how long shutdowns would last, but certainly not expecting them to last as long as they have, we rushed to get an English-language survey put together and disseminated as quickly as possible. Upon realizing we were “in it for the long haul,” we developed a more comprehensive data collection plan, launching another two series of surveys in five languages: English, Spanish, Korean, and Chinese (traditional and simplified).
Here, we’ll share survey results from South Korean and Chinese-speaking respondents. We’ll also highlight the most interesting findings across time as well as make some comparisons between different language groups and geographic regions, occasionally including the United States and Europe. A more in-depth analysis of the results from English and Spanish language groups can be found here.
Methodology and Respondent Demographics
Surveys were disseminated in Korean and Chinese, with the Chinese survey available in both simplified and traditional characters. The first set of surveys went out in June 2020 and the second set in March 2021. All the surveys were nearly identical in content, making for easier comparisons between the different time points and languages.
Each survey was open for approximately two weeks and the survey was shared via SCA communication channels. Across our Korean-language surveys, 226 people responded to the first survey in June 2020, and 177 to the second in March 2021. Survey respondents in traditional Chinese had inconsistent access to the initial survey platform used in June 2020, so the data presented for that time period only reflects responses from those who took the survey written in simplified Chinese. For the March 2021 surveys, results from traditional and simplified Chinese were combined into a single category for analysis. In total, Chinese-speaking respondents 132 completed the first survey, and 136 completed the second.

Table 1 Location of Chinese Speaking Respondents
In terms of geographic location, all the Korean-speaking respondents for both surveys were presumed to be located in South Korea. For Chinese-speaking respondents, we did not presume location, and the most represented countries are listed in Table 1.
In general, most respondents come from the coffee retail and coffee education sectors. In the first Korean survey in June 2020 survey, 44% of respondents identified themselves as coffee retailers, 19% as “other,” and 17% as manufacturers/suppliers, with many of the respondents in the “other” category identifying as working in coffee education. In the March 2021 survey, the option for education was added to list of options. In that survey 36% percent of respondents identified as working in education, along with 29% as coffee retailers and 7% as roaster wholesalers.
For the business types for Chinese-speaking respondents, in the June 2020 survey 40% of respondents were retailers, 10% roaster wholesalers, and 10% coffee buyers. In the March 2021 survey, 34% of respondents were coffee retailers, 21% worked in education, and 10% were coffee buyers.
Before diving into the results, we’d like to quickly note that this survey has not been subjected to the scrutiny of statistical rigor, so the results presented here should be interpreted with a bit of caution. The data from these surveys is intended to be descriptive—a snapshot in time illuminating the experiences of self-selected respondents—rather than perfectly representative of the a given coffee community.
Loss in Sales
Beginning with the Korean-speaking survey results, in general respondents reported a more negative impact to their businesses from March 2021 compared to June 2020. One of the data points that best exemplifies this trend is the percent loss of sales due to COVID-19. This data is represented graphically in Figure 1, with June 2020 data in blue and March 2021 data in red. The vertical axis represents the proportion of respondents who selected one of the response options on the horizontal axis. The shift of responses to the right indicates a higher percentage loss of sales for [7] survey takers, with the least severe losses towards the left (0-15% losses) and the most severe losses on the right (100% loss of sales).

Figure 1. Data from the survey question "If your organization is already experiencing a decrease in sales related to the coronavirus, please select the percent decrease (estimates are fine)."

Examining the responses from June of 2020 survey, we see that the majority of respondents reported losing a quarter or less of their sales as a result of COVID-19. Of course, any loss in sales is undesirable, but the majority of June 2020 responses clustering to the left of the graph indicates more respondents are losing sales at lower rates. Moving to March 2021 survey results, the shift of response frequency to the right of the graph indicates more respondents reported higher losses in sales; two thirds of respondents reported lost sales between 26% and 75% sales due to COVID-19.
To contextualize the reported increase in loss of sales and the overall more negative sentiment amongst Korean-speaking respondents, it is helpful to cross-reference with COVID-19 data in South Korea. At the time of the first survey in June 2020, cases and deaths rates were quite low with average weekly new cases and deaths hovering in the low 100s per day, but by mid-March 2021 cases and deaths had quadrupled, though down from the late December peaks in the 1000s.

Figure 2. Data from the question " If your organization is already experiencing a decrease in sales related to the coronavirus, please select the percent decrease (estimates are fine)."

Data from the Chinese-speaking respondents reflects the opposite trend: The overall impact of the COVID-19 pandemic in March 2021 was less severe than it was in June 2020. When asked the same question, Chinese speakers reported fewer lost sales across time, and also as compared to Korean-speaking respondents. Figure 2 compares the loss in sales data from June 2020 to March 2021 for Chinese-speaking respondents, where the shift to left of the proportion of respondents indicates less severe loss in sales between the two time periods.
Again, comparing this data to the number of new COVID-19 cases and deaths, but this time in China, we see that the more positive sentiment appears to be related to low case counts and, perhaps in the case of China, time since the most recent spike. By June 2020, cases in China were in the low 10s and 20s, a huge decreases compared to the February 2020 peaks of 6,900 new cases a day. In March 2021, cases were equally as low as they were in June 2020, but presumably the extended period of time with low case counts increases consumer confidence and willingness to spend.
Universal Themes: Challenges to Profitability and Future Optimism
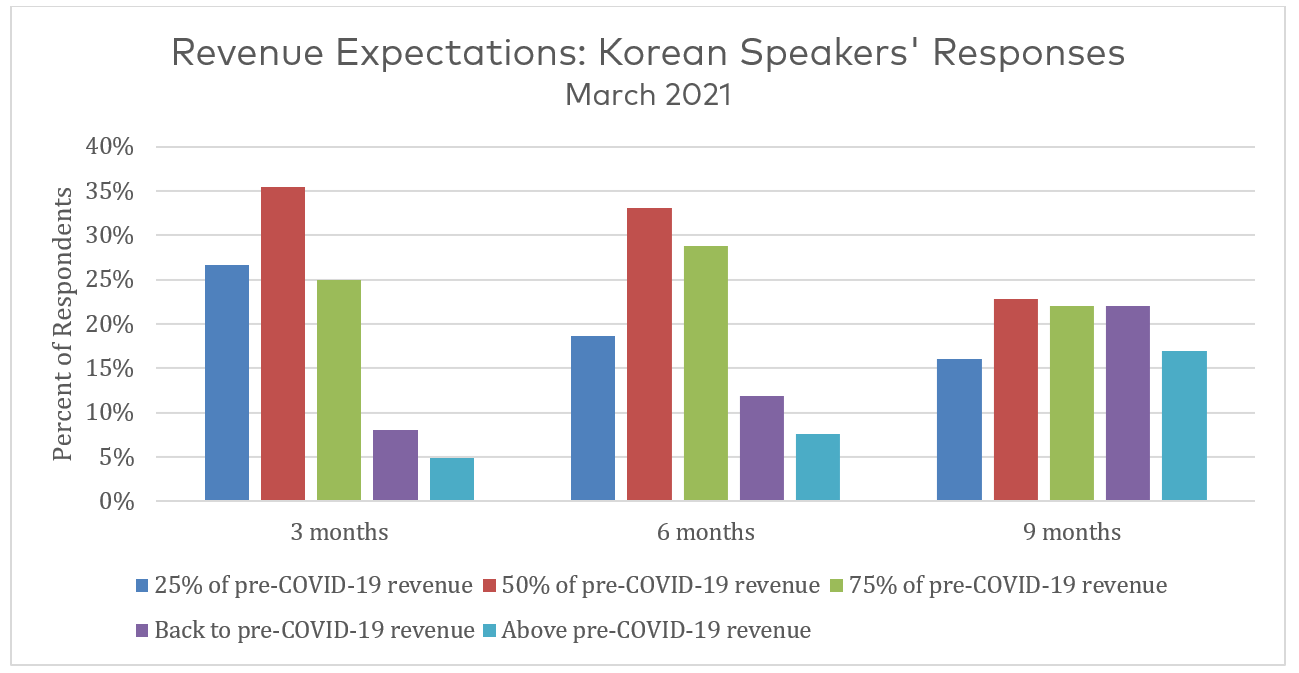
Figure 3 Data from the survey question: Where do you expect your revenue to be in the next 3, 6, and 9 months, relative to your revenue pre-COVID-19?
One theme that was prevalent across all the respondents was an increase in business expenses since the pandemic began. The global increase in the price of goods across supply chains has been well-documented and is largely attributed to increased and shifting demand for consumer goods, exacerbated by low inventory of shipping containers and supply-side challenges in conducting business during the pandemic.[1]
Unsurprisingly, the results from most recent set of surveys indicates that the global coffee industry was not immune to price increases. All the language groups and geographies we surveyed reported a rise in the cost of goods. Commonly cited sources included green coffee, delivery and shipping costs, and supplies/materials (generally).

Figure 4 Data from the survey question: Where do you expect your revenue to be in the next 3, 6, and 9 months, relative to your revenue pre-COVID-19?
In addition to the increased prices of goods normally purchased during the pandemic, coffee businesses are also incurring new costs to operate safely. Items such as personal protective equipment (PPE), cleaning and sanitation products, and protective barriers were all listed as sources of increased costs of conducting business. Finally, a large number of businesses reported that the combination of these two trends, decreasing revenue coupled with rising prices and operating costs, has made maintaining a viable revenue to cost ratio incredibly challenging.
Despite the reported surge in prices and costs of running a business, optimism for the future was a common theme amongst all survey respondents, though the magnitude of positivity varied across regions. To understand respondents’ optimism, we asked: “Where do you expect your revenue to be in the next 3, 6, and 9 months?” Response options used business pre-COVID-19 revenue as a baseline from the March 2021 set of surveys, and best captures respondents’ future outlooks.
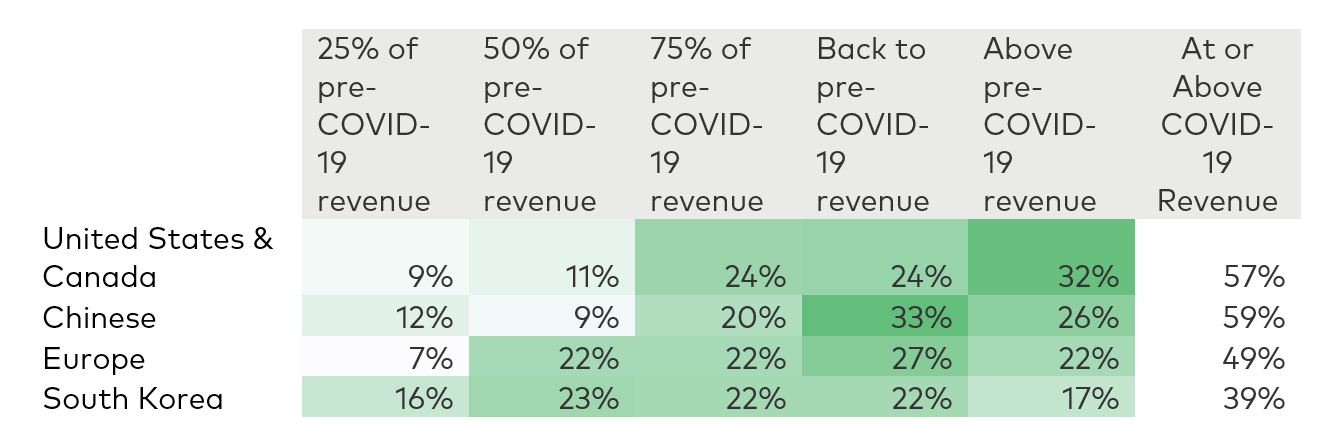
Table 2 Revenue Expectations in the nine-month time horizon from March 2021 survey data
Examining the responses from South Korea, it’s clear that respondents’ expectations for the three-month time horizon are fairly bleak, with 62% of respondents anticipating revenue equal to or below 50% of their pre-COVID revenue. That outlook softens in the nine-month time horizon, with 39% of respondents expecting to be below 50% pre-COVID-19 revenue and 39% of respondents expecting to return to or exceed pre-COVID-19. Compared to the South Korean respondents, Chinese survey takers were much more positive, with almost 60% of respondents anticipating returning to or exceed pre-COVID revenue in nine months’ time.
Looking just at the nine-month time horizon, Table 2 compares results from across language groups and geographies from the March 2021 survey. Respondents located in the United States and Canada reported quite positive expectations for the future, with 57% of respondents expecting to return to or exceed their pre-COVID-19 revenue in nine months’ time. Europeans appear somewhat less positive than those located in United States and Canada, as well as Chinese-speaking respondents. Finally, though South Koreans expect improvement in their revenues across time, they reported the weakest expectation return to pre-COVID-19 business levels.
Mitigation and Recovery
When asked what mitigation strategies worked best, the most common (and perhaps predictable) answers cited by Korean and Chinese-speaking respondents were: online marketing and sales, marketing at-home consumption, delivery service, and private training (for educators). South Korean respondents also highlighted that careful management of costs as an important competency to staying in business, presumably as they experience substantial pressure from both side of the profit equation: revenue decreases and cost increases, particularly across green coffee and labor cost per customer.
With these results, we can glean a few key takeaways. The first is that the many of the effects of the pandemic and the paths to recovery are diverse between and within geographies, and also across time. At the same time, some of the impacts of the pandemic are universally experienced. Coffee businesses around the world reported increased costs of doing business, in part from rising prices for materials and also from a need for staff to perform disease prevention tasks in addition to their regular duties. And finally, the last takeaway is a shared, albeit uneven, optimism that recovery in is the foreseeable future.
KATIE VON DER LIETH is the SCA’s Research Program Manager and KYONGHEE SHIN is a Regional Community Director.
References
[1] Lynch, David. 2021. Pandemic aftershocks overwhelm global supply lines. January 24. https://www.washingtonpost.com/business/2021/01/24/pandemic-shipping-economy/.