Less Strong, More Sweet – 25 Magazine, Issue 11
If you ask most people to describe how black coffee tastes, you will almost invariably hear the word bitter.
Graduate student MACKENZIE BATALI, Professor CARLITO LEBRILLA, Professor JEAN-XAVIER GUINARD, and Professor WILLIAM D. RISTENPART share surprising results of “fractionation” experiments at UC Davis exploring the natural sweetness of black drip brew coffee in partnership with the SCA and Breville Corporation.
If you talk to aficionados of specialty coffee, however, you quickly learn that other sensory attributes are paramount. In fact, a word you are likely to hear from coffee experts, often uttered in reverential tones, is sweetness.
Typical consumers associate sweetness in coffee with the act of stirring in sugar or artificial sweetener, but that’s not what we’re talking about here. Rather, coffee experts have long known that black coffee, without any additives, can have perceptible sweetness. Considered by many to be the holy grail of specialty coffee, natural sweetness is a sublime pleasure for those who get to enjoy it in the cup. At the same time, however, natural sweetness can be maddening to those who need to make it happen. Anybody who sources, roasts, or brews coffee professionally knows that delivering natural sweetness in black coffee isn’t easy: sweetness is fleeting, fluctuating from lot to lot of beans or in response to minor differences in roast or brew conditions. This difficulty raises an important question: How do you maximize the natural sweetness in black coffee?
The science is far from settled, but we are happy to report that the UC Davis Coffee Center has made significant strides in understanding at least part of the puzzle. Starting in 2017, we partnered with the SCA to perform an extensive scientific study of drip brew coffee, with support from the Breville Corporation. The goal of the multi-pronged research effort is to understand how different brewing parameters affect the sensory attributes of drip brew coffee. Preliminary results were highlighted previously in the SCA’s quarterly publication, 25, as well as in the Journal of Food Science. Further work explored the entirety of the classic “coffee brewing control chart,” with exciting results that will be discussed soon.
Here we focus on the surprising results about natural sweetness in drip brew coffee. Specifically, we wanted to understand how the chemical composition and the sensory qualities of drip brew coffee change as the brew progresses. While the first brewed coffee that comes out of the filter is obviously darker than coffee that comes out later, nobody in the scientific literature had measured this behavior and the corresponding impact on sensory quality. We set out to study this phenomenon in detail.
Designing the Experiment
To measure the chemical and sensory aspects of coffee over time, we performed what scientists refer to as “fractionation” (Fig. 1).[1] The basic idea is that during the course of a 4-minute brew on a commercial drip brewer, we swapped out the carafe every 30 seconds, yielding 8 distinct fractions of brewed coffee, with fraction 1 corresponding to 0 to 30 seconds, fraction 2 corresponding to 31 to 60 seconds and so on. For good measure, we performed an additional identical brew, without fractionation, so that we could also compare the “whole brew” (WB) properties against the individual fractions.

Fig. 1: “Fractionation,” illustrated. Over the course of a four-minute brew, researchers would change the carafe every 30 seconds in order to better understand how the chemical composition and sensory qualities of the brew change as it progresses.
To rigorously answer the question “How did each fraction taste?”, we turned to our expert descriptive panel. This panel functions quite differently from the “cupping” panel prevalent in the coffee industry. The panellists were first recruited and selected by passing a series of “discrimination” triangle tests, where they had to identify correctly which of three coffee samples was different from the other two. Then, we spent several weeks calibrating the panel, by training them on the SCA/WCR Coffee Taster’s Flavor Wheel with appropriate sensory references. Finally, the panelists tasted the fractions in the sensory descriptive isolation booths at the UC Davis Robert Mondavi Institute. These booths are designed to isolate the panellist to minimize context bias, including using red lights to minimize expectation bias based on how dark the coffee looks.
One of the most important differences between cupping and descriptive sensory testing is that there is no “quality,” “value,” or “liking” score – it is simply an objective measure of the intensity of sensory attributes. In theory, the panel should function as a reproducible instrument to measure exactly what is perceptible in the brewed coffee. We had the expert panel assess 23 different taste and flavor attributes, such as bitter, sour, floral, berry, etc., for 9 different sample types (8 fractions plus 1 whole brew sample), all served blinded and in random serving order, with 3 separate “trial replicates.” With 12 expert panelists, the tastings involved a total of 9×3×12 = 324 servings of coffee and 7,452 individual sensory data points – a wealth of data. We also measured the corresponding physical measures of each fraction, including the total dissolved solids (TDS) that reflect the actual “strength” of the brew.
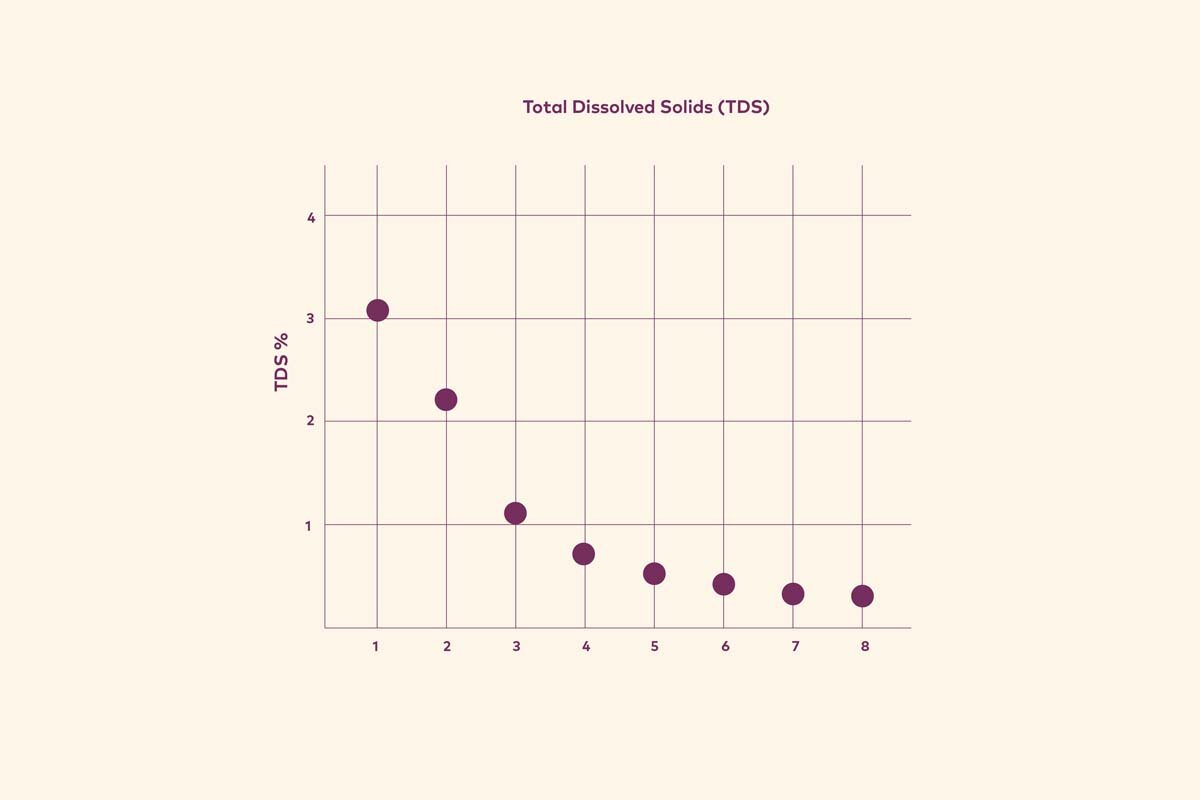
Fig. 2: The “strength” of each fraction, as determined by the percentage of total dissolved solids (TDS) in each fraction.
Resulting Sensory Trends
Analysis of the data revealed some pronounced and systematic trends (Fig. 3) Focusing first on bitter, we see that the intensity of perceived bitterness (here averaged over the entire panel) was highest in the first fraction, and then systematically decreased with later fractions (red points in Fig. 3). Importantly, this decrease in perceived bitterness is well correlated with the TDS of each fraction (purple points in Fig 2). The early fractions had high TDS, while the later fractions had lower TDS, decreasing nearly tenfold. Thus the decrease in perceived bitterness is interpreted in terms of a lower concentration of dissolved molecules. In other words, the later fractions tasted less bitter simply because they were less strong. Several other sensory attributes, such as sour, astringent, and smoky likewise decreased as the brew strength decreased.

Fig. 3: Attribute intensity as identified by the expert descriptive panel across each fraction. Here, we see pronounced and systematic trends: “bitter” and “sour” decrease over time, while “tea/floral” and “sweet” increase.
Surprisingly, though, some sensory attribute intensities actually increased in the later fractions. Most excitingly, sweetness systematically increased with later fractions (black points in Fig. 3). Several other sensory attributes also increased with later fractions, including floral, honey, and fruity – all attributes that are typically considered desirable in specialty coffee. We emphasize that the panelists were served these fractions in random order, so the systematic increase in sweetness reflects a real and statistically significant trend.
The result was extremely surprising, because these later fractions had much lower TDS. In other words, the fewer coffee molecules in the liquid, the sweeter it tasted. This behavior is very unusual in the world of sensory science; if you add more and more sugar to water, for example, you will perceive it as more and more sweet. The idea that you can have lower concentrations and higher perceived sweetness is quite counterintuitive.
Testing the Chemistry
Given that sweetness increased in the later fractions at lower brew strengths, a key question is: Why? There were several possibilities. The first and most obvious explanation is that the later fractions actually had a higher relative concentration of dissolved natural sugars. About 10% by mass of a green Arabica coffee bean is sucrose, which is the scientific name for ordinary table sugar. The sucrose in the green beans typically does not survive the roasting process: the sucrose undergoes a variety of different complicated chemical reactions, all of which combine to help give coffee its wonderful flavor. Of particular relevance, during roasting, larger complex carbohydrates break down into what scientists call monosaccharides, which means “single sugars.” These can also have a perceptible sweetness. Thus, one possible explanation for our sensory data is that monosaccharides like fructose or glucose more slowly extracted from the solid coffee grounds during the brew, yielding higher concentrations at later fractions – and thus higher perceived sweetness.

Fig. 4: Mapping the collective presence of monosaccharides, or “single sugars,” in each fraction against thresholds of human perception. Interestingly, the total concentration of all the sugars present in each fraction is well below the threshold of human perception, illustrated by the red line at the top.
To test this hypothesis, we turned from human tasters to analytical chemistry techniques. Specifically, we used liquid chromatography and mass spectrometry to identify and measure the concentrations of monosaccharides present in each fraction. The data revealed two surprising trends (Fig. 4). First, we found that the concentration of sugars was highest in the first fraction and smaller in later fractions, indicating we could rule out the “slow dissolution” hypothesis. More importantly, the mass spectrometry measurements firmly established that the total concentration of all the sugars present, in any fraction, was well below the sensory perception threshold for sugars (red line in Fig. 4), meaning that human tasters are not capable of perceiving the sugar in the coffee we tested.
What Does It All Mean?
That’s right: The perceived sweetness had nothing to do with the sugars present in the brew. Something else must have caused the increase in sweetness perceived in the later fractions.
There are at least a couple of possibilities. One is that the human brain associates certain flavor attributes with things that are sweet, so the mind is “tricked” into thinking the presence of those attributes means there must be sweetness, a phenomenon that has been established in other beverage and food products. This hypothesis accords with the observation that the perceived sweetness increased in tandem with perceived floral, honey, and fruity flavors. Another likely mechanism involves “masking.” The higher concentration of bitter and sour compounds present in the earlier fractions inhibits or “masks” the intrinsic sweetness, which is only revealed at later fractions where there are fewer bitter and sour compounds.
Put more simply, it turns out that the holy grail of natural sweetness in coffee might be lurking near the end of every brew. If nothing else, the fractionation approach described here gives coffee aficionados another avenue of exploration in their search for the perfect cup.
CARLITO LEBRILLA, JEAN-XAVIER GUINARD, and WILLIAM D. RISTENPART are professors in the Coffee Center at the University of California Davis, where MACKENZIE BATALI is pursuing a Ph.D. in Food Science and Technology.
Brew for Thought
The current paradigm for brewing coffee is “one brew, one flavor profile.” Instead, the results shown here raise the possibility of “one brew, multiple flavor profiles.” Much like how a craft whiskey distiller chooses which “cuts” or fractions of liquid distillate to combine in the final whiskey, coffee professionals could select which fractions to combine from the same brew to yield distinct beverages to serve to customers. For example, a brew composed mostly of the intensely bitter and sour early fractions might appeal to those who prefer adding lots of cream and sugar, while a brew composed mostly of the sweeter later fractions might appeal strongly to those who prefer coffee with more delicate tea-like, floral, fruity, and sweet flavor notes.
[1] For this part of the research project, we used a Java City Colombian coffee from the Huila region (Agtron score: 54). All samples were brewed at 91.5°C (196.7°F) and served at a temperature between 55°C and 60°C (131–140°F).
Special Thanks to Our Issue 11 Advertisers
The print and digital release of 25, Issue 11 is supported by Bellwether Coffee, BWT Water+more, Cropster, Wilbur Curtis, DaVinci Gourmet, Faema, Lavazza,
and Softengine Coffee One.